Represent Networks as
3D Shapes
WebShapes lets you upload any network and visualize it as a geometric 3D shape — capturing structural properties in a compact, interpretable form.
Try It Now →What are Network Shapes?
A three-step pipeline: sample subgraphs, embed each in 3D, then fit a geometric shape — producing an interpretable structural fingerprint of any network.
Sample
Randomly draw many subgraphs from the network using node, edge, or walk-based strategies.
Embed
Map each subgraph to a 3D point via graph2vec, Kronecker, Spectral Moments (m₂,m₃,m₄), or Network Statistics.
Fit
Fit a 3D shape — convex hull, sphere, or cuboid — around the cloud of embedded points.
How to Use WebShapes
Choose Parameters
Select sampling method, sample count, embedding, and fitting type from the sidebar.
Select a Network
Pick from built-in datasets or upload your own tab-delimited edge list (up to 10 MB).
Visualize
Click Visualize and watch real-time progress. Small networks finish in seconds.
Download
Download the figure and boundary point files for your analysis.
Sampling Methods
Random Node
Select nodes uniformly at random and take the induced subgraph.
Random Edge
Retain edges at random; preserves the global degree distribution well.
Random Walk
Simulate a random walk with restart to obtain a locally coherent connected subgraph.
Forest Fire
Spread from a seed node like a forest fire to capture densely connected local regions.
Snowball (BFS)
Breadth-first expansion from a random seed; samples connected neighborhoods.
Metropolis-Hastings
MCMC-based walk that corrects for degree bias, producing more representative subgraphs.
Embedding Methods
graph2vec
Treats the graph as a document and rooted subgraphs as words; learns a 3D vector via Doc2Vec-style neural training.
Kronecker Point
Fits a 2×2 Stochastic Kronecker Graph initiator (a, b, d) to each subgraph via maximum-likelihood estimation.
Spectral (m₂, m₃, m₄)
The Spectral Point from KDD 2020: the 2nd, 3rd, and 4th spectral moments of the random-walk transition matrix. Interpretable: m₂ relates to degree distribution, m₃ to triangles, m₄ to squares. All values lie in [0, 1].
Network Statistics
Embeds each subgraph as a 3-tuple of classical network statistics — degree, clustering coefficient, and density — for a fast, interpretable baseline.
Fitting Methods
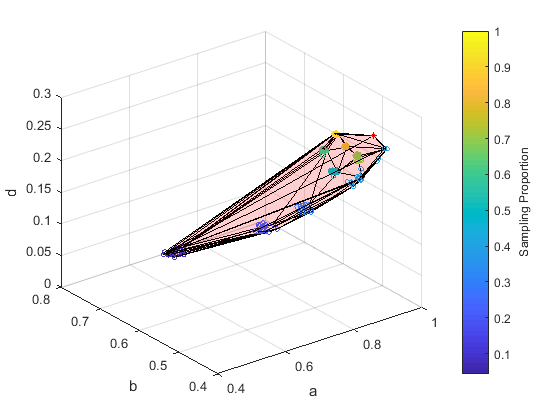
Convex Hull
The smallest convex set enclosing all embedded points. Saved as boundary vertices.
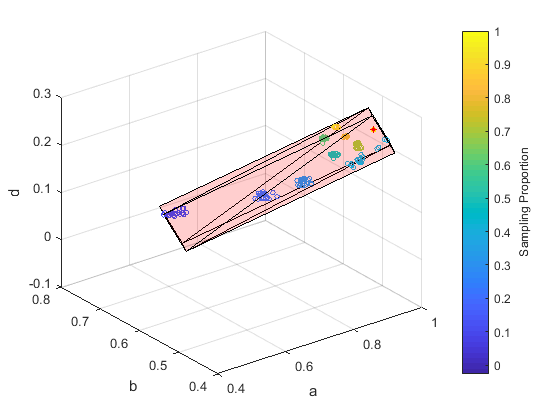
Cuboid
Axis-aligned bounding box saved as 8 corner points of the minimal enclosing box.
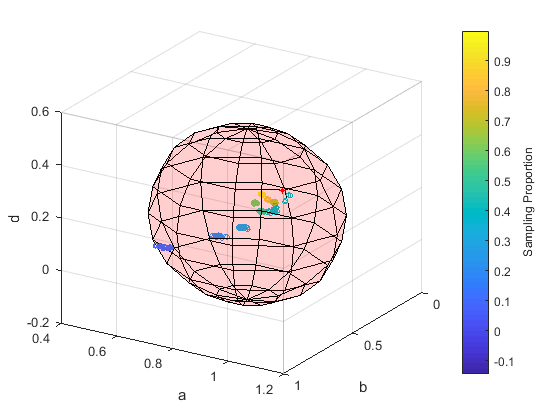
Sphere
Minimum enclosing sphere saved as center coordinates and radius.
Publications
Jin, Shengmin, and Reza Zafarani. "Representing Networks with 3D Shapes." IEEE International Conference on Data Mining (ICDM), 2018.
Read the Paper →Jin, Shengmin, and Reza Zafarani. "The Spectral Zoo of Networks: Embedding and Visualizing Networks with Spectral Moments." ACM SIGKDD Conference on Knowledge Discovery and Data Mining (KDD), 2020.
Read the Paper →